 To launch labAlive simulation applications you need a Java Runtime Environment supporting Java Web Start on your system. Here you can get more information about installing the right Java version.
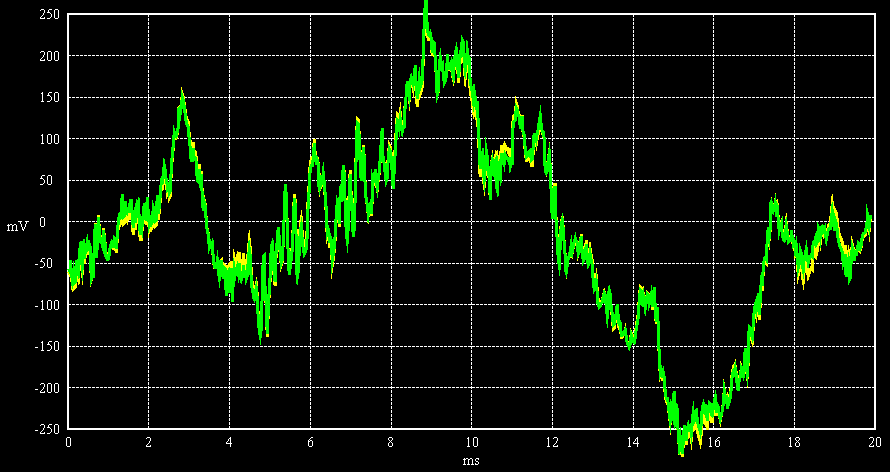
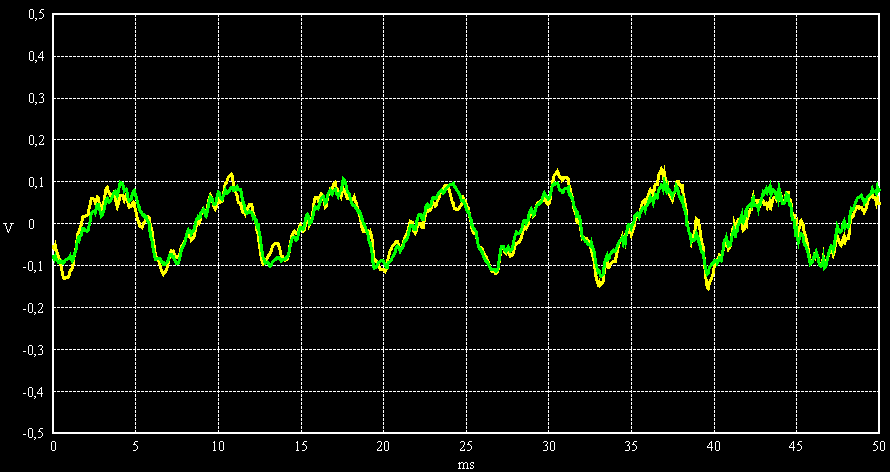
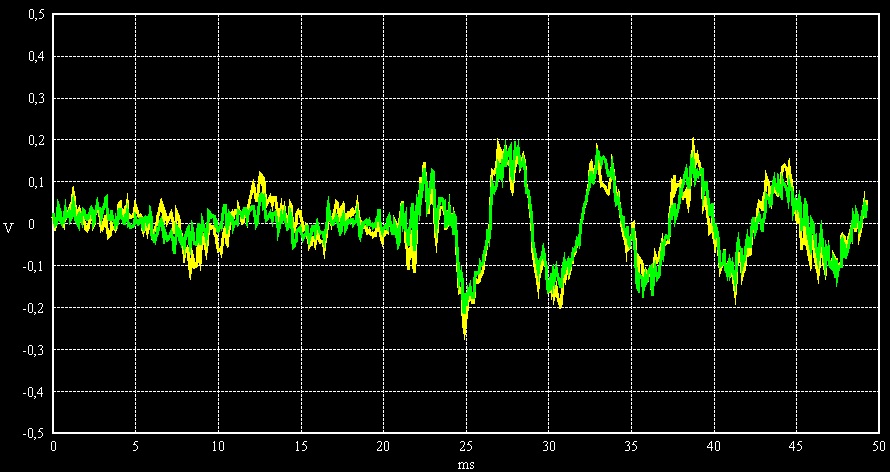
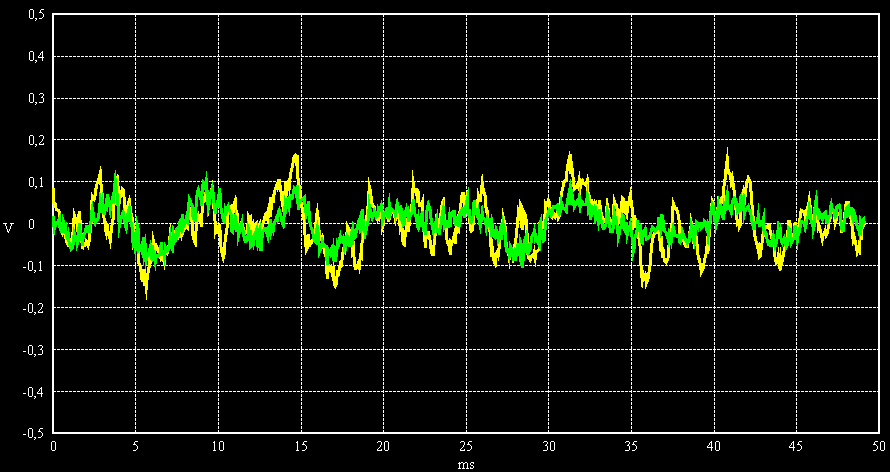
This demonstration shows various signals interfered by noise. Evaluate the signal quality!
- The more the interfered signal (yellow) differs from the original signal (green) the less is the signal quality.
- It's the relative difference not the absolute that matters.
Thus, the signal quality is measured as the ratio of signal power to noise power: Signal-to-noise ratio (SNR).
The Signal-to-noise ratio is usually measured in decibels (dB).
Launch the app and try out how different signals will be interfered by noise depending on the S/N-ratio.
| SNR | Sine wave | Audio signal |
|---|---|---|
| 20 dB | 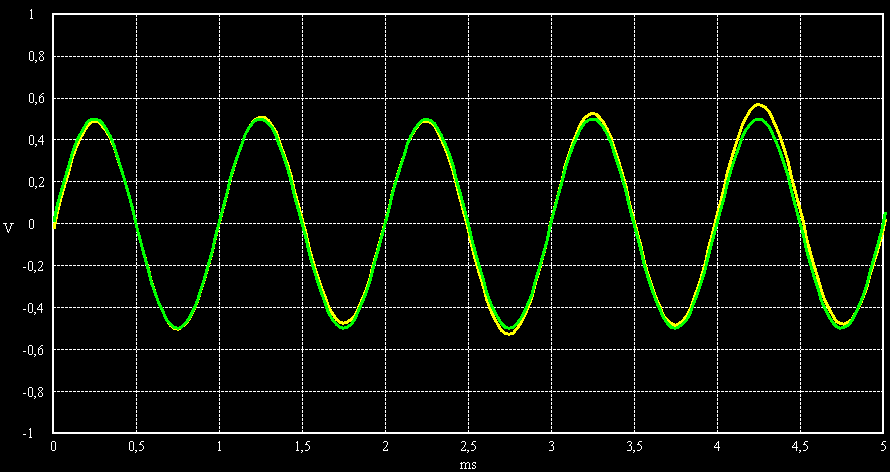 |
 |
| 10 dB | 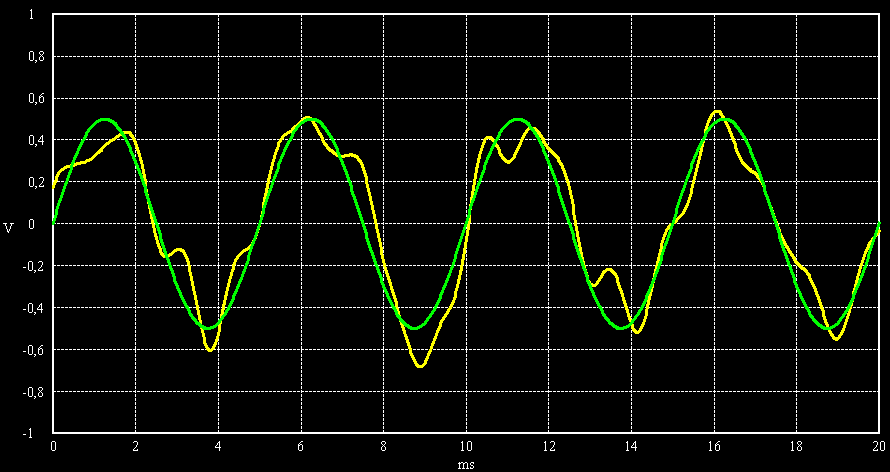 |
 |
| 6 dB | 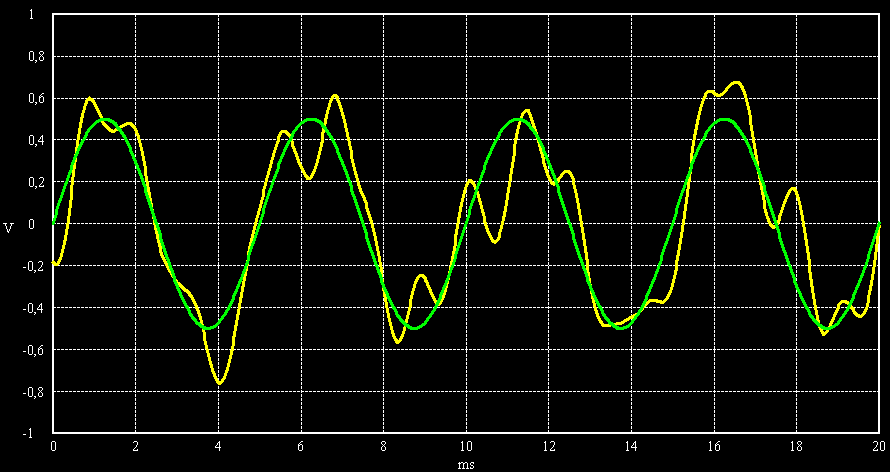 |
 |
| 3 dB | 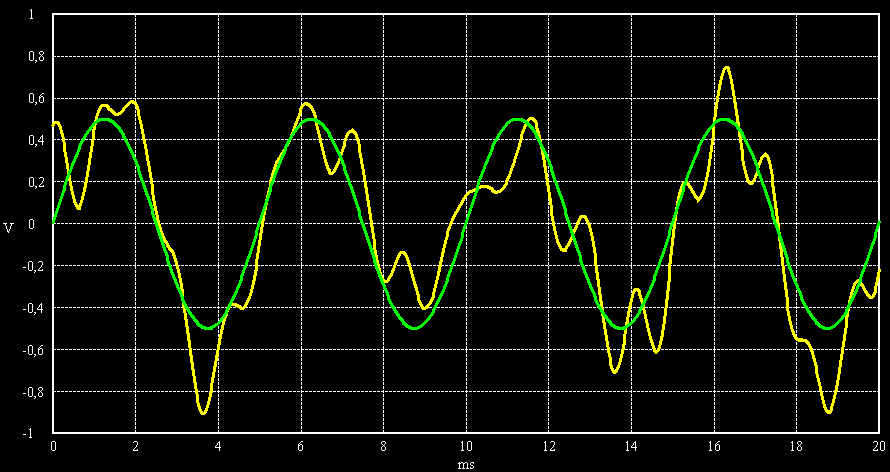 |
 |
| 0 dB | 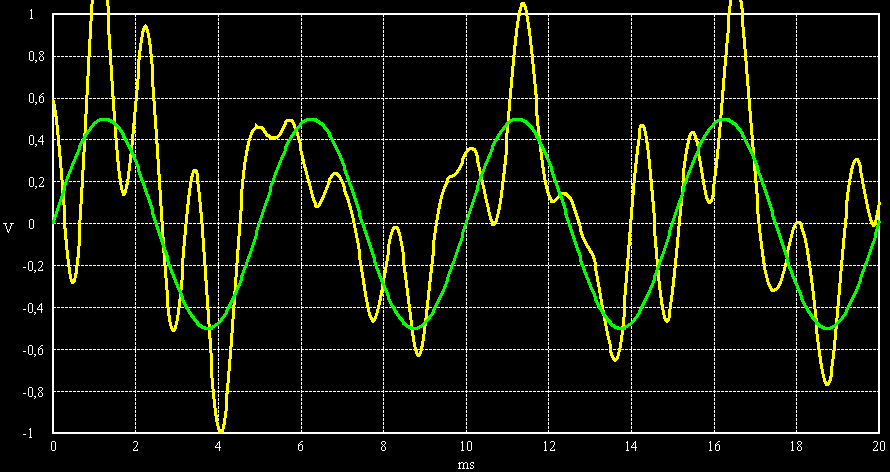 |
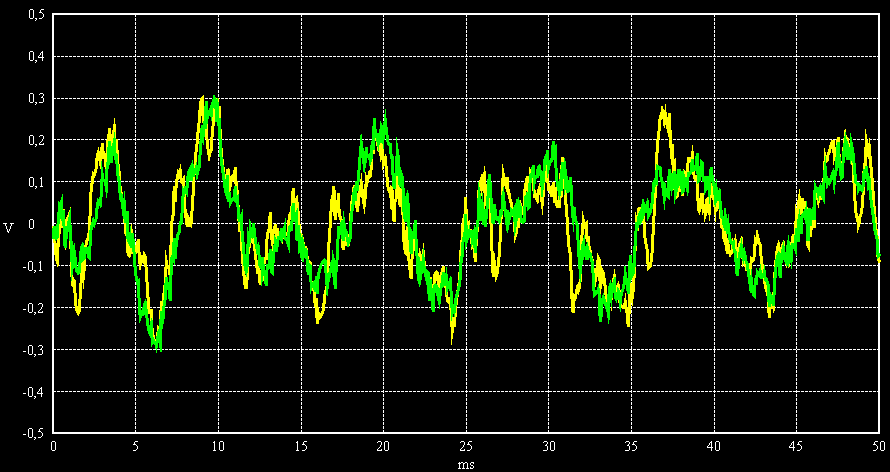 |
Sine wave and audio signals with SNR = 20 dB, 10dB, 6 dB, 3 dB and 0 dB. Noise bandwidth is 1000 Hz.
See also
The same scenarios with a noise bandwidth 200 Hz are shown is this experiment: Noise bandwidth demonstration.
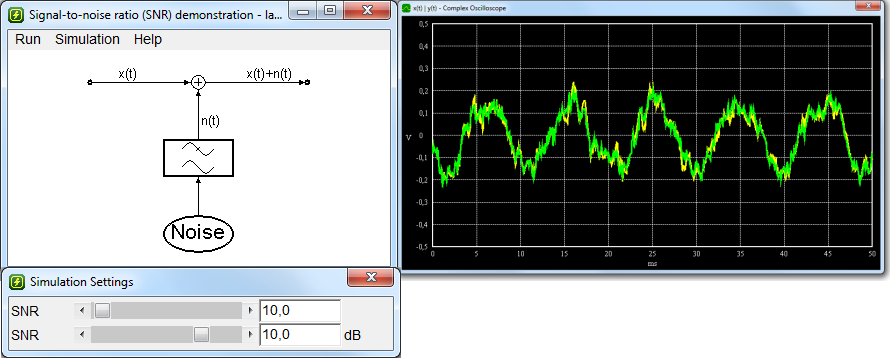
A signal x(t) is superimposed by noise.
Adjust the signal-to-noise ratio (SNR) and produce different signal qualities. Analyze the impact of Gaussian noise on the selected signal.
- See how the interfered signal (yellow) differs from the original signal (green).
- Listen to the interfered sound signal.
Further interactive options:
- Click on source: Audio or signal generator waveforms can be selected.
- Click on filter: Noise bandwidth can be set. See also SNR and noise bandwidth demonstration