 To launch labAlive simulation applications you need a Java Runtime Environment supporting Java Web Start on your system. Here you can get more information about installing the right Java version.
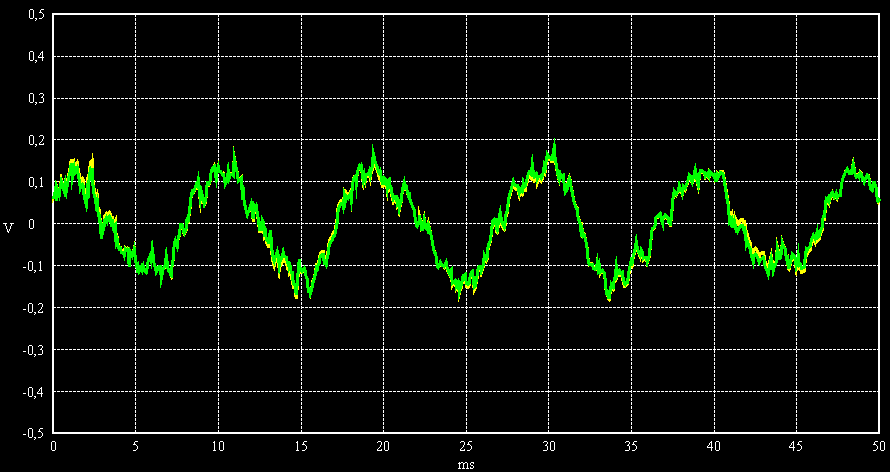
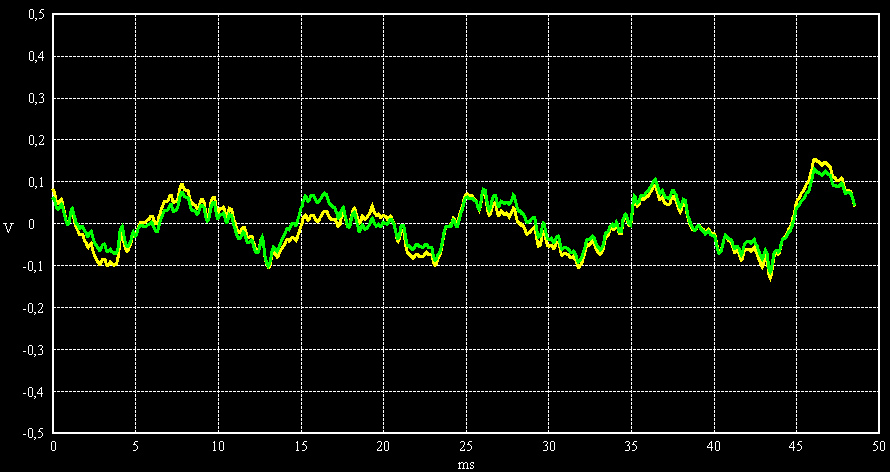
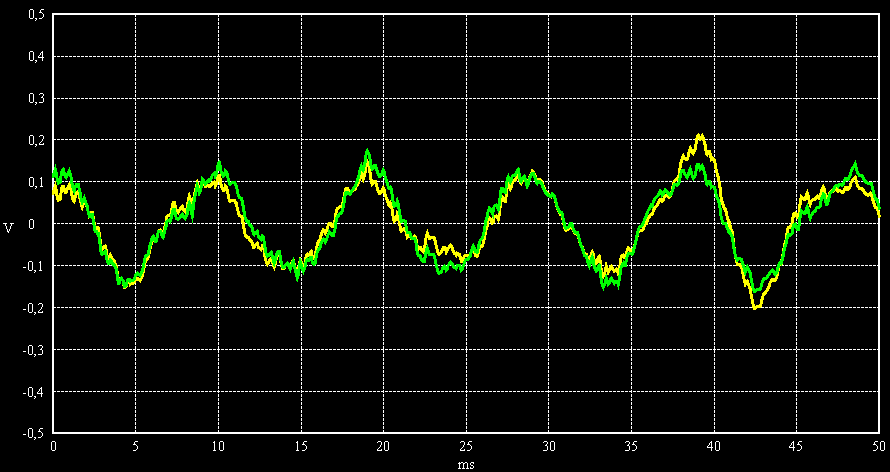
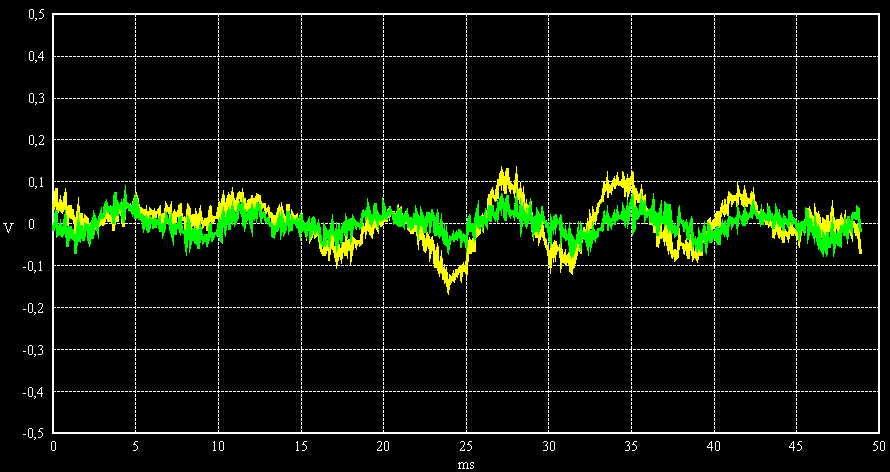
This demonstration shows example signals interfered by noise with variable bandwidth. The signal-to-noise ratio (SNR) is a measure for the signal quality. Visually evaluate the signal quality and noise bandwidth!
- Noise bandwidth is 200 Hz in images below.
- Noise bandwidth of 1000 Hz is shown in images in SNR demonstration.
| SNR | Sine wave | Audio signal |
|---|---|---|
| 20 dB | 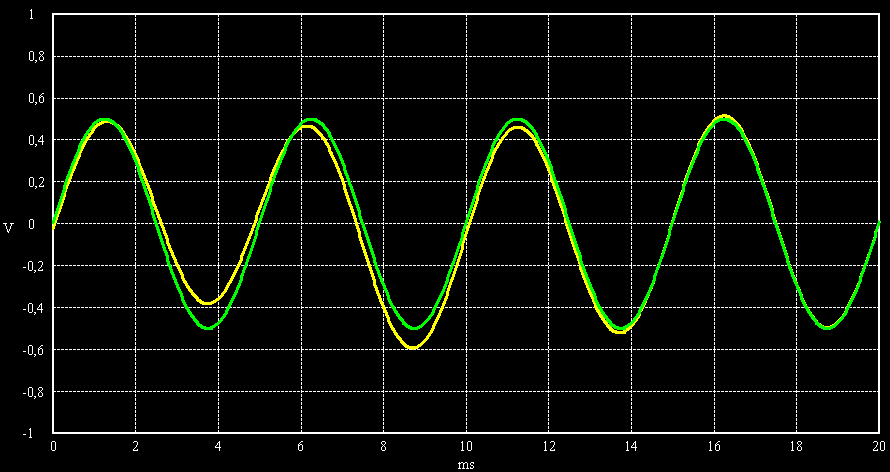 |
 |
| 10 dB | 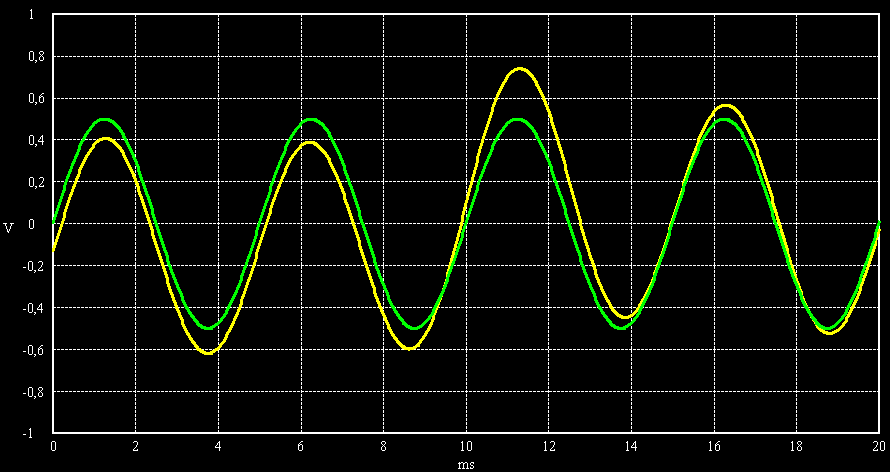 |
 |
| 6 dB | 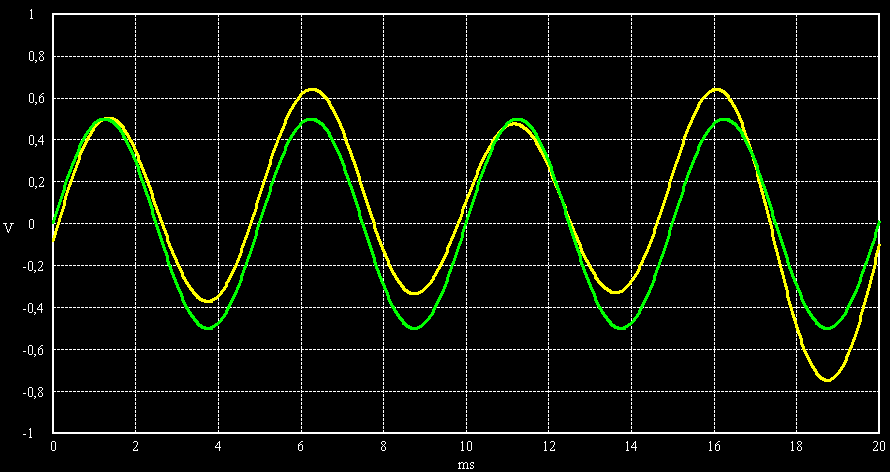 |
 |
| 3 dB | 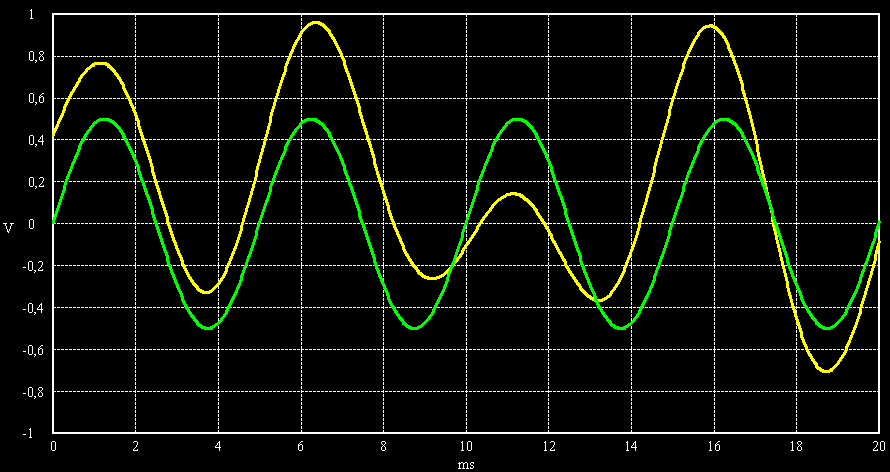 |
 |
| 0 dB | 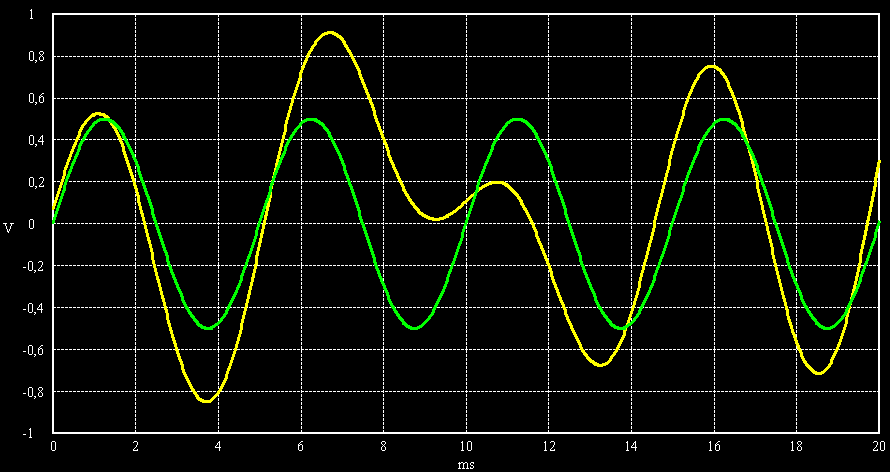 |
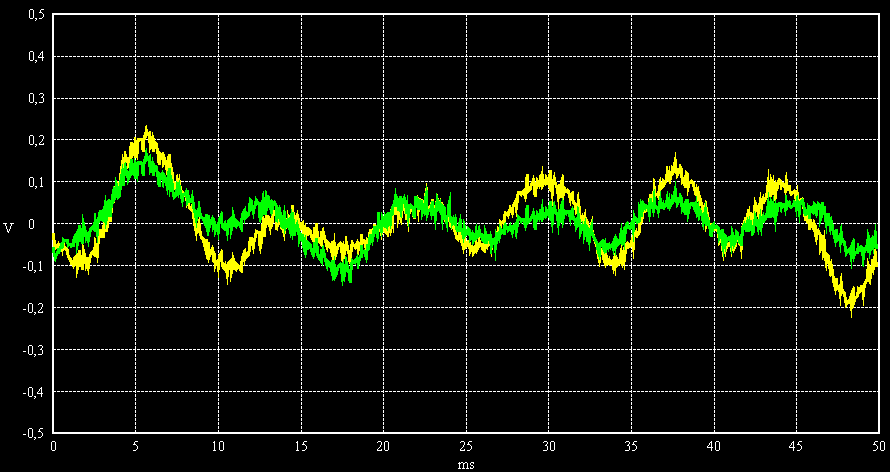 |
Sine wave and audio signals with SNR = 20 dB, 10dB, 6 dB, 3 dB and 0 dB. Noise bandwidth is 200 Hz.
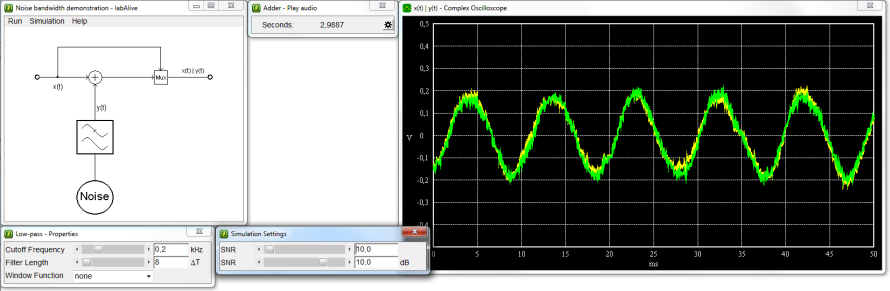
Enter a signal-to-noise ratio (SNR) and noise bandwidth.
Enter a SNR and noise bandwidth (cutoff frequency of low-pass) and then analyze the impact of Gaussian noise on any signal.
- The interfered signal (yellow) differs from the original signal (green).
- Listen to the sound signal.
Try out how your chosen signal will be interfered by noise depending on the noise bandwidth. Click on the start button ![]() .
.
Interactive options:
- Click on source: Audio or signal generator waveforms can be selected.
- Click on source: Signal can be switched off to see and listen only to the noise.
Note that in this simulation the noise power and SNR remains constant when the noise bandwidth (cutoff frequency of low-pass) changes.