FFT spectrum analyzer

    Start To launch labAlive simulation applications you need a Java Runtime Environment supporting Java Web Start on your system. Here you can get more information about installing the right Java version. title="Start via Windows Batch Start" onclick="gtag('event', 'FftSpectrumanalyzer', {'event_category': 'Launch bat', 'event_label': 'FFT spectrum analyzer'});">

Students should become familiar with the settings to perform measurements in the frequency domain.

The FFT spectrum analyzer

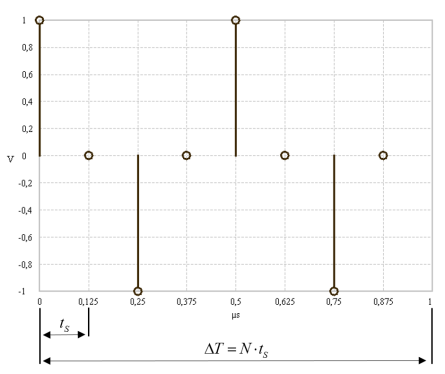
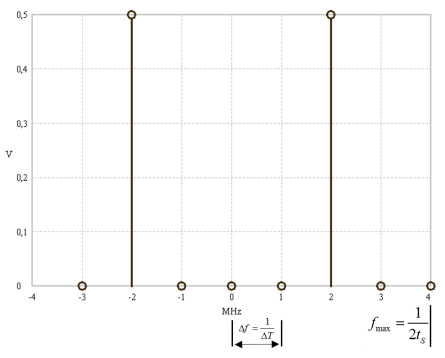
Sampling time determines the spectrum's highest available frequency. Capture time determines the resolution bandwidth. The figure below illustrates these relationships for FFT measurements.

Sample record length definition
Resolution bandwidth definition
FFT measurements: Maximum detectable frequency is half the sampling rate. Frequency resolution is the reciprocal of the record length.

Sampling time and the number of samples taken determine the spectrum's highest frequency and resolution bandwidth.

ΔT=N t S MathType@MTEF@5@5@+= feaagKart1ev2aqatCvAUfeBSjuyZL2yd9gzLbvyNv2CaerbuLwBLn hiov2DGi1BTfMBaeXatLxBI9gBaerbd9wDYLwzYbItLDharqqtubsr 4rNCHbGeaGqiVu0Je9sqqrpepC0xbbL8F4rqqrFfpeea0xe9Lq=Jc9 vqaqpepm0xbba9pwe9Q8fs0=yqaqpepae9pg0FirpepeKkFr0xfr=x fr=xb9adbaqaaeGaciGaaiaabeqaamaabaabaaGcbaGaeuiLdqKaam ivaiabg2da9iaad6eacqGHflY1caWG0bWaaSbaaSqaaiaadofaaeqa aaaa@3E56@ and f max = 1 2 t S MathType@MTEF@5@5@+= feaagKart1ev2aqatCvAUfeBSjuyZL2yd9gzLbvyNv2CaerbuLwBLn hiov2DGi1BTfMBaeXatLxBI9gBaerbd9wDYLwzYbItLDharqqtubsr 4rNCHbGeaGqiVu0Je9sqqrpepC0xbbL8F4rqqrFfpeea0xe9Lq=Jc9 vqaqpepm0xbba9pwe9Q8fs0=yqaqpepae9pg0FirpepeKkFr0xfr=x fr=xb9adbaqaaeGaciGaaiaabeqaamaabaabaaGcbaGaamOzamaaBa aaleaaciGGTbGaaiyyaiaacIhaaeqaaOGaeyypa0ZaaSaaaeaacaaI XaaabaGaaGOmaiaadshadaWgaaWcbaGaam4uaaqabaaaaaaa@3E76@ and Δf= 1 ΔT MathType@MTEF@5@5@+= feaagKart1ev2aqatCvAUfeBSjuyZL2yd9gzLbvyNv2CaerbuLwBLn hiov2DGi1BTfMBaeXatLxBI9gBaerbd9wDYLwzYbItLDharqqtubsr 4rNCHbGeaGqiVu0Je9sqqrpepC0xbbL8F4rqqrFfpeea0xe9Lq=Jc9 vqaqpepm0xbba9pwe9Q8fs0=yqaqpepae9pg0FirpepeKkFr0xfr=x fr=xb9adbaqaaeGaciGaaiaabeqaamaabaabaaGcbaGaeuiLdqKaam Ozaiabg2da9maalaaabaGaaGymaaqaaiabfs5aejaadsfaaaaaaa@3C58@

where

t S MathType@MTEF@5@5@+= feaagKart1ev2aqatCvAUfeBSjuyZL2yd9gzLbvyNv2CaerbuLwBLn hiov2DGi1BTfMBaeXatLxBI9gBaerbd9wDYLwzYbItLDharqqtubsr 4rNCHbGeaGqiVu0Je9sqqrpepC0xbbL8F4rqqrFfpeea0xe9Lq=Jc9 vqaqpepm0xbba9pwe9Q8fs0=yqaqpepae9pg0FirpepeKkFr0xfr=x fr=xb9adbaqaaeGaciGaaiaabeqaamaabaabaaGcbaGaamiDamaaBa aaleaacaWGtbaabeaaaaa@37F4@ Sampling time
N MathType@MTEF@5@5@+= feaagKart1ev2aqatCvAUfeBSjuyZL2yd9gzLbvyNv2CaerbuLwBLn hiov2DGi1BTfMBaeXatLxBI9gBaerbd9wDYLwzYbItLDharqqtubsr 4rNCHbGeaGqiVu0Je9sqqrpepC0xbbL8F4rqqrFfpeea0xe9Lq=Jc9 vqaqpepm0xbba9pwe9Q8fs0=yqaqpepae9pg0FirpepeKkFr0xfr=x fr=xb9adbaqaaeGaciGaaiaabeqaamaabaabaaGcbaGaamOtaaaa@36CA@ Number of samples (FFT length)
ΔT MathType@MTEF@5@5@+= feaagKart1ev2aqatCvAUfeBSjuyZL2yd9gzLbvyNv2CaerbuLwBLn hiov2DGi1BTfMBaeXatLxBI9gBaerbd9wDYLwzYbItLDharqqtubsr 4rNCHbGeaGqiVu0Je9sqqrpepC0xbbL8F4rqqrFfpeea0xe9Lq=Jc9 vqaqpepm0xbba9pwe9Q8fs0=yqaqpepae9pg0FirpepeKkFr0xfr=x fr=xb9adbaqaaeGaciGaaiaabeqaamaabaabaaGcbaGaeuiLdqKaam ivaaaa@3836@ Sample record length
f max MathType@MTEF@5@5@+= feaagKart1ev2aqatCvAUfeBSjuyZL2yd9gzLbvyNv2CaerbuLwBLn hiov2DGi1BTfMBaeXatLxBI9gBaerbd9wDYLwzYbItLDharqqtubsr 4rNCHbGeaGqiVu0Je9sqqrpepC0xbbL8F4rqqrFfpeea0xe9Lq=Jc9 vqaqpepm0xbba9pwe9Q8fs0=yqaqpepae9pg0FirpepeKkFr0xfr=x fr=xb9adbaqaaeGaciGaaiaabeqaamaabaabaaGcbaGaamOzamaaBa aaleaaciGGTbGaaiyyaiaacIhaaeqaaaaa@39E2@ Maximum detectable frequency
Δf MathType@MTEF@5@5@+= feaagKart1ev2aqatCvAUfeBSjuyZL2yd9gzLbvyNv2CaerbuLwBLn hiov2DGi1BTfMBaeXatLxBI9gBaerbd9wDYLwzYbItLDharqqtubsr 4rNCHbGeaGqiVu0Je9sqqrpepC0xbbL8F4rqqrFfpeea0xe9Lq=Jc9 vqaqpepm0xbba9pwe9Q8fs0=yqaqpepae9pg0FirpepeKkFr0xfr=x fr=xb9adbaqaaeGaciGaaiaabeqaamaabaabaaGcbaGaeuiLdqKaam Ozaaaa@3848@ Resolution bandwidth

This experiment illustrates the basic settings to control the FFT spectrum analyzer. The FFT spectrum analyzer acquires a discrete-time signal, computes the spectrum using the FFT algorithm and displays these frequency components. In this example, the number of samples (FFT length) N MathType@MTEF@5@5@+= feaagKart1ev2aqatCvAUfeBSjuyZL2yd9gzLbvyNv2CaerbuLwBLn hiov2DGi1BTfMBaeXatLxBI9gBaerbd9wDYLwzYbItLDharqqtubsr 4rNCHbGeaGqiVu0Je9sqqrpepC0xbbL8F4rqqrFfpeea0xe9Lq=Jc9 vqaqpepm0xbba9pwe9Q8fs0=yqaqpepae9pg0FirpepeKkFr0xfr=x fr=xb9adbaqaaeGaciGaaiaabeqaamaabaabaaGcbaGaamOtaiabg2 da9iaaigdacaaIYaGaaGioaaaa@3A09@ is 128 MathType@MTEF@5@5@+= feaagKart1ev2aqatCvAUfeBSjuyZL2yd9gzLbvyNv2CaerbuLwBLn hiov2DGi1BTfMBaeXatLxBI9gBaerbd9wDYLwzYbItLDharqqtubsr 4rNCHbGeaGqiVu0Je9sqqrpepC0xbbL8F4rqqrFfpeea0xe9Lq=Jc9 vqaqpepm0xbba9pwe9Q8fs0=yqaqpepae9pg0FirpepeKkFr0xfr=x fr=xb9adbaqaaeGaciGaaiaabeqaamaabaabaaGcbaGaamOtaiabg2 da9iaaigdacaaIYaGaaGioaaaa@3A09@ .

Sampling time t S = 0.5 μ s MathType@MTEF@5@5@+= feaagKart1ev2aqatCvAUfeBSjuyZL2yd9gzLbvyNv2CaerbuLwBLn hiov2DGi1BTfMBaeXatLxBI9gBaerbd9wDYLwzYbItLDharqqtubsr 4rNCHbGeaGqiVu0Je9sqqrpepC0xbbL8F4rqqrFfpeea0xe9Lq=Jc9 vqaqpepm0xbba9pwe9Q8fs0=yqaqpepae9pg0FirpepeKkFr0xfr=x fr=xb9adbaqaaeGaciGaaiaabeqaamaabaabaaGcbaGaamiDamaaBa aaleaacaWGtbaabeaakiabg2da9iaaicdacaGGUaGaaGynaiaaykW7 cqaH8oqBcaWGZbaaaa@3F68@
Sample record length Δ T = N t S = 64 μ s MathType@MTEF@5@5@+= feaagKart1ev2aqatCvAUfeBSjuyZL2yd9gzLbvyNv2CaerbuLwBLn hiov2DGi1BTfMBaeXatLxBI9gBaerbd9wDYLwzYbItLDharqqtubsr 4rNCHbGeaGqiVu0Je9sqqrpepC0xbbL8F4rqqrFfpeea0xe9Lq=Jc9 vqaqpepm0xbba9pwe9Q8fs0=yqaqpepae9pg0FirpepeKkFr0xfr=x fr=xb9adbaqaaeGaciGaaiaabeqaamaabaabaaGcbaGaeuiLdqKaam ivaiabg2da9iaad6eacqGHflY1caWG0bWaaSbaaSqaaiaadofaaeqa aOGaeyypa0JaaGOnaiaaisdacqaH8oqBcaWGZbaaaa@4392@
Highest frequency f max = 1 2 t S = 1 2 0.5 μ s = 1 M H z MathType@MTEF@5@5@+= feaagKart1ev2aqatCvAUfeBSjuyZL2yd9gzLbvyNv2CaerbuLwBLn hiov2DGi1BTfMBaeXatLxBI9gBaerbd9wDYLwzYbItLDharqqtubsr 4rNCHbGeaGqiVu0Je9sqqrpepC0xbbL8F4rqqrFfpeea0xe9Lq=Jc9 vqaqpepm0xbba9pwe9Q8fs0=yqaqpepae9pg0FirpepeKkFr0xfr=x fr=xb9adbaqaaeGaciGaaiaabeqaamaabaabaaGcbaGaamOzamaaBa aaleaaciGGTbGaaiyyaiaacIhaaeqaaOGaeyypa0ZaaSaaaeaacaaI XaaabaGaaGOmaiaadshadaWgaaWcbaGaam4uaaqabaaaaOGaeyypa0 ZaaSaaaeaacaaIXaaabaGaaGOmaiabgwSixlaaicdacaGGUaGaaGyn aiabeY7aTjaadohaaaGaeyypa0JaaGymaiaad2eacaWGibGaamOEaa aa@4C8F@
Resolution bandwidth Δ f = 1 Δ T = 1 64 μ s = 15.625 k H z MathType@MTEF@5@5@+= feaagKart1ev2aqatCvAUfeBSjuyZL2yd9gzLbvyNv2CaerbuLwBLn hiov2DGi1BTfMBaeXatLxBI9gBaerbd9wDYLwzYbItLDharqqtubsr 4rNCHbGeaGqiVu0Je9sqqrpepC0xbbL8F4rqqrFfpeea0xe9Lq=Jc9 vqaqpepm0xbba9pwe9Q8fs0=yqaqpepae9pg0FirpepeKkFr0xfr=x fr=xb9adbaqaaeGaciGaaiaabeqaamaabaabaaGcbaGaeuiLdqKaam Ozaiabg2da9maalaaabaGaaGymaaqaaiabfs5aejaadsfaaaGaeyyp a0ZaaSaaaeaacaaIXaaabaGaaGOnaiaaisdacaaMc8UaeqiVd0Maam 4CaaaacqGH9aqpcaaIXaGaaGynaiaac6cacaaI2aGaaGOmaiaaiwda caaMc8Uaam4AaiaadIeacaWG6baaaa@4D94@
example time record of signal
QPSK transmission spectrum - non-averaged (1)
Time record of signal (left) and corresponding spectrum (right).
example time record of signal - zoom
QPSK transmission spectrum - non-averaged (1)
Time record zoom shows sampling time (left) and spectrum zoom shows resolution bandwidth (right).
QPSK transmission spectrum - non-averaged (2)
QPSK transmission spectrum - averaged
As the QPSK transmit symbols are random the spectrum varies for each time record (left). This shows the need to average the spectrum (right).

Start the simulation and open the spectrum analyzer settings Setting Button and reduce the resolution bandwidth. Also switch Averaging off and on.

Spectrum analyzer settings
QPSK transmission spectrum - reduced resolution bandwidth
Spectrum analyzer settings (left). Spectrum with reduced resolution bandwidth Δf=3.90625kHz MathType@MTEF@5@5@+= feaagKart1ev2aqatCvAUfeBSjuyZL2yd9gzLbvyNv2CaerbuLwBLn hiov2DGi1BTfMBaeXatLxBI9gBamXvP5wqonvsaeHbd9wDYLwzYbqe e0evGueE0jxyaibaieYlf9irVeeu0dXdh9vqqj=hEeeu0xXdbba9fr Fj0=OqFfea0dXdd9vqaq=JfrVkFHe9pgea0dXdar=Jb9hs0dXdbPYx e9vr0=vr0=vqpWqaaeaabiGaciaacaqabeaadaqaaqaaaOqaaiabfs 5aejaadAgacqGH9aqpqaaaaaaaaaWdbiaaiodacaGGUaGaaGyoaiaa icdacaaI2aGaaGOmaiaaiwdacaaMc8+daiaadUgacaWGibGaamOEaa aa@440E@ (right).

Note that:

This simulation app provides an online spectrum analyzer. It allows frequency domain analysis with similar control settings to RF spectrum analyzers. Students should become familiar with the settings to perform measurements in the frequency domain.

QPSK Equivalent Baseband
Transmitted signal
Spectrum analyzer settings
Spectrum analyzer display and control panel. It allows frequency domain analysis with similar control settings to RF spectrum analyzers.

Open the spectrum analyzer settings: